Deciding to go solar is not just an excellent decision to help improve the environment, it’s an excellent investment with far less financial risk and potentially better returns than buying stock market shares. Learning how to calculate your solar return on investment is not difficult, takes only a few minutes, and may very well open your eyes to the best decision you’ll ever make with your money.

A solar return on investment can range anywhere from 10% to 30% per year, whereas, adjusted for inflation, the historical average annual return for the S&P 500 is only around 7%. As well, according to the latest statement by Forbes, an investment portfolio is currently expected to return between 7 and 7.5% in the long-term.
It’s a no-brainer decision — investing in free, clean, renewable solar energy to power your home instead of throwing away your money on expensive, toxic fossil fuels will potentially make you more money than the stock market and will definitely make you a solar-superhero in the eyes of all your family, friends, and neighbors.
So, What is a Solar Return on Investment?
A solar return on investment, also referred to as a solar ROI, is a calculation of financial profit. Think of it as similar to the annual percentage rate (APR) on a savings account in a bank and it will probably seem more familiar. No bank in America is offering 10% interest, but for the sake of argument, imagine you deposit $10,000 in a savings account with a 10% APR and never touch the money. At the end of one year, you will have made $1,000 in interest. So, your profit for the year is $1,000, and your savings account return on investment for this year is 10%. Simply put, the savings ROI calculation looks like:
(Your Annual Profit) (e.g. $1,000)
÷ (Your Amount in the Bank) (e.g. $10,000)
= (Your Savings Account Return on Investment %) (e.g. 10%)
How to Calculate a Solar Return on Investment
A solar return on investment is calculated very similarly as a savings account ROI:
(Your Annual Profit)
÷ (Your Net System Cost)
= (Your Solar Return on Investment %)
Now, in order to plug in the numbers, we need to break down the calculation into small bites, making it easier to chew. While every solar power system is unique, the calculation is stable. You simply need to plug in your answers for each of these questions (don’t worry if you don’t know the answers yet, just follow the examples and more details will be provided below):
?A? Net Cost — What’s the net cost of your solar power system? (total costs, minus tax deductions, credits, rebates, etc.)
example: $11,760 — Based on $16,800 total cost for an average 6 kW system at $2.80/watt installed (NREL), minus $5,040 (30% Federal ITC).
?B? Ave. kWh/day Generated — How much energy in kWh does your solar power system generate on average in one day?
example: 22.5 kWh of energy per day – assuming a 6 kW system, unshaded, with southern-facing panels and using the national peak sun hour average.
?C? Price Charged/kWh — What’s the price of energy per kWh charged by your local utility company? (find this on your electric bill)
example: $0.13/kWh – based on EIA’s national average for May 2018
?D? Ave. Daily Use % — (Only if tied to the grid) What % of the solar energy produced daily is, on average, used by your home? (find this on your electric bill)
example: 70% – chosen arbitrarily
?E? Price Credited/kWh — (Only if tied to the grid) What’s the price you are being paid per kWh by your utility company for excess energy? (find this on your electric bill)
example: $0.07/kWh – chosen arbitrarily

Calculating an Off-Grid Solar Return on Investment
Here’s how you pull all the answers together in 3 easy steps for an off-grid solar power system based on the examples given above (off-grid is quicker, so we’re doing it first):
1) ?A? (e.g. $11,760)
= (Net System Cost) (e.g. $11,760)
2) ?B? (ave. kWh/day generated — e.g. 22.5 kWh)
x ?C? (price charged/kWh — e.g. $0.13/kWh)
x 365
= (Your Annual Profit) (e.g. $1,067.625)
3) (Your Annual Profit) (e.g. $1,067.625)
÷ (Your Net System Cost) (e.g. $11,760)
= (Your Solar Return on Investment %) (e.g. .09078 or 9.1%)
Congratulations, your off-grid superhero solar investment is super awesome with a return of 9.1%! Not many investments can compare with that rate of return, especially considering the low risks and high esteem that come bundled with your shiny new solar power system. Over the course of your system’s lifespan, conservatively estimated at 25+ years, you’ll save every penny that you used to pay to the electric company and you’ll be laughing all the way to the bank!

Calculating a Grid-Tied Solar Return on Investment
Now we’ll do the calculation for a grid-tied system. It’s a bit more involved because any excess energy being sold to the grid daily must be taken into consideration. Here’s how it’s done in 7 quick steps, based on the same examples given above:
1) ?A? (e.g. $11,760)
= (Net System Cost) (e.g. $11,760)
2) ?B? (ave. kWh/day generated — e.g. 22.5 kWh)
x ?D? (ave. daily use % — e.g. 70%)
= (Your Daily Consumption) (e.g. 15.75 kWh)
3) (Your Daily Consumption) (e.g. 15.75 kWh)
x ?C? (price charged/kWh — e.g. $0.13/kWh)
x 365
= (Your Annual Savings) (e.g. $748.25)
4) ?B? (ave. kWh/day generated — e.g. 22.5 kWh)
x (100% – ?D?) (100% minus ave. daily use % — e.g. 30%)
= (Your Daily Excess) (e.g. 6.75 kWh)
5) (Your Daily Excess) (e.g. 6.75 kWh)
x ?E? (price credited/kWh — e.g. $0.07/kWh)
x 365
= (Your Annual Credit) (e.g. $172.46)
Okay, now that we’ve got all these nice numbers figured out, we can get to the juicy annual profit:
6) (Your Annual Savings) (from step 3 — e.g. $748.25)
+ (Your Annual Credit) (from step 5 — e.g. $172.46)
= (Your Annual Profit) (e.g. $920.71)
And finally, we can now see how your delicious, sun-ripened solar return matches up against Forbes and the stock market:
7) (Your Annual Profit) (e.g. $920.71)
÷ (Your Net System Cost) (e.g. $11,760)
= (Your Solar Return on Investment) (e.g. 7.8%)
Congratulations, you’re a solar-superhero with a very nice solar return on investment of 7.8%! Not only is this rate higher than both Forbes’ long-term expectations and the historical average of the S&P 500, it comes without the risks associated with stock market investments.
It also means you’ve got a very bright future ahead, filled with plenty of free, clean solar energy powering your home, paying you back for your purchase, and saving you loads of money!

Here’s an Extra Perk: Calculate Your Solar PayBack Period
While you’ve got all these nice numbers still spread out on the table, let’s see how quickly you’ll be generating completely free electricity.
Determining how many years it will take for your solar system to completely pay you back for its net cost is easy; just refer to the final off-grid or grid-tied calculation above and simply invert the division:
(Your Net System Cost) (e.g. $11,760)
÷ (Your Annual Profit) (e.g. off-grid: $1,068 or grid-tied: $920.71)
= (Your Solar PayBack Period) (e.g. off-grid: 11 years or grid-tied: 12 years 9 months)
Once your solar power system has generated enough annual savings in energy costs to cover the net price of your solar system, all of your household energy use will be completely free! Considering that the average warranty period for an average solar power system is 25+ years, this means that our off-grid example will be producing totally free, clean electricity for another 14 years (at the very least), and racking up $1,068 annually for a tidy sum of $14,946.82! Our grid-tied system is pretty fantastic, too, racking up $920.71 in the clear every year for at least another 12 years beyond the payback period–that’s $11,048.40!
Everyone’s Solar Return on Investment is Unique
Getting the best value for your money is the key to maximizing your solar return on investment. And, as you understand, the solar return on investment calculation asks questions that will always have unique answers according to each solar power system and its physical location.
Going back over the questions we answered above, here are some helpful details and tips:
?A? What’s the net cost of your solar power system?
- Costs — The total cost of a solar power system is dependent on the size of the system you select, the quality of equipment and components, labor charges, permitting fees, etc. Your total cost may differ, but the latest data (2017) from the National Renewable Energy Laboratory (NREL) states that $2.80/watt is the average installed price for a residential solar power system. Be careful to keep all of your records and receipts in a safe location.
- Deductions — The Federal ITC tax deduction allows up to 30% of your total solar power system cost to help offset your federal tax amount owed. The full 30% can be deducted in one year, or a portion can be deducted and the rest carried over to the next year/s. But keep in mind that the ITC deduction starts ramping down at the end of 2019, dropping to 26% for projects started in 2020, continuing down to 22% for 2021, and in 2022 will hit 0% for residential solar projects. State tax credits, rebates, etc., are dependent on your home’s location and need to be researched carefully. Try checking here and here.
?B? How much energy in kWh does your solar power system generate on average in one day?
- Daily Solar Energy Generation — The geographical location of your home, your home’s exposure to direct sunlight, and the quality of your solar panels all have an impact on how much solar power your system will generate on an average day. Using the examples provided above, an average, unshaded, southern-facing, 6 kW solar power system produces an average range of 17.4 to 27.6 kWh of energy per day, assuming the national average of 5.0 “peak sun hours,” also expressed as 5.0 “kWh/m²/day.”
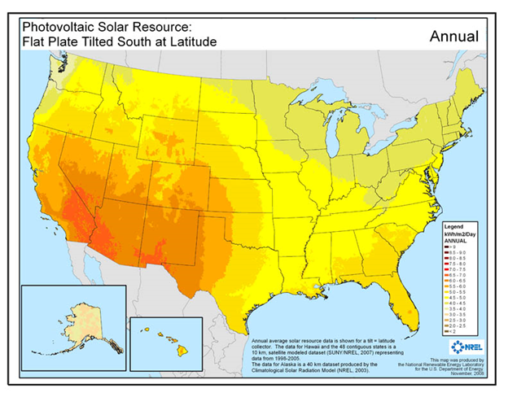
- Peak Sun Hours — Your average peak sun hours may be different than the national average of 5.0. The NREL image below provides a good starting point for determining your state’s average peak sun hours, but a local solar installer will be able to determine your daily solar energy generation amount by examining your unique situation.

?C? What’s the price of energy per kWh charged by your local utility company?
- Energy Price per kWh — This price will be indicated on your current utility bill. According to the US Energy Information Administration (EIA), the national average electricity rate as of May 2018 is $0.13/kWh. (Research all state rates here)
?D? (Only if tied to the grid) What % of the solar energy produced daily is, on average, consumed by your home?
- Daily Energy Use % — The amount of energy your home uses on an average day is usually expressed in kWh on your electricity bill. Locate and compare this number with ?B? (average daily solar energy generation) to determine what percent of generation is being used. For example, the average US household uses 10,766 kWh of electricity a year, or 29.5 kWh a day, according to the latest data (2016) from the US Energy Information Administration (EIA). Continuing with our example, 29.5 kWh of daily energy use exceeds the highest average daily solar energy generation of 27.6 kWh so our example answer to ?D? would be 100%. In this case, in fact, we would have to pull some electricity from the grid to supplement what the solar panels are generating. Personally, I’d ease off the air conditioning!
?E? (Only if tied to the grid) What’s the price you are being paid per kWh by your utility company for excess energy?
- Daily Energy Excess Credit – If you are tied to the grid and not using all the electricity your solar power system is generating, your utility company may offer a credit for every excess kWh that is released to the grid. Find this credit amount on your bill, or research your zip code on the Database of State Incentives for Renewables & Efficiency (DSIRE). Typically the credit offered by the utility company is considerably lower than the price they are charging you per kWh — just one more reason to consider adding a battery storage component to your system so you can save your excess energy and pull from your storage when you need it.
Solar Power – The Best Investment Opportunity of Your Life
Now that you’ve learned how to calculate your solar return on investment, and recognize the low-risk, highly-profitable benefits that are available by going solar, what are you waiting for? As the price of electricity continues to rise, your solar return on investment will continue to soar, too, right up there with your solar-superhero status among family, friends, and neighbors!
If your overall investment strategy doesn’t yet include solar power generation, you are clearly missing the best investment opportunity of your life. Join the solar power revolution today!
Leave a Reply
Solar Savings Calculator
Get the facts. Find out exactly how much solar will save you, including which Tax and Financial programs you qualify for!


