


California is ground zero for solar energy in the United States. So, it seems logical to start our state-level solar energy deep dives here. In the article below, I’ll provide as thorough a look at California solar incentives + solar installers + solar costs as I’ve seen anywhere. Actually, it is more thorough than anything I’ve seen.
Naturally, if you read through this and know of more California solar energy facts or resources I should look at and include, let me know in the comments!
Solar Incentives
The first thing to know is that there’s a solar investment tax credit (ITC) available across the United States that offers a credit from the federal government of up to 30% of the cost of a solar installation. However, you have to have that much tax liability in a single year in order to take advantage of the full credit. Additionally, the 30% credit runs through 2019, after which, a phaseout of the incentive begins (under current law). Here are some more details from the US Department of Energy:
Solar-electric property
- 30% for systems placed in service by 12/31/2019
- 26% for systems placed in service after 12/31/2019 and before 01/01/2021
- 22% for systems placed in service after 12/31/2020 and before 01/01/2022
- There is no maximum credit for systems placed in service after 2008.
- Systems must be placed in service on or after January 1, 2006, and on or before December 31, 2021.
- The home served by the system does not have to be the taxpayer’s principal residence.
Solar water-heating property
- 30% for systems placed in service by 12/31/2019
- 26% for systems placed in service after 12/31/2019 and before 01/01/2021
- 22% for systems placed in service after 12/31/2020 and before 01/01/2022
- There is no maximum credit for systems placed in service after 2008.
- Systems must be placed in service on or after January 1, 2006, and on or before December 31, 2021.
- Equipment must be certified for performance by the Solar Rating Certification Corporation (SRCC) or a comparable entity endorsed by the government of the state in which the property is installed.
- At least half the energy used to heat the dwelling’s water must be from solar in order for the solar water-heating property expenditures to be eligible.
- The tax credit does not apply to solar water-heating property for swimming pools or hot tubs.
- The home served by the system does not have to be the taxpayer’s principal residence.
Across California, certain solar energy systems are exempt from property taxes, so no need to worry about increasing your tax bill.
Probably the second-biggest incentive for California solar consumers is the state’s net metering policy — hence the reason fossil fuel & monopolistic utility companies have been routinely attacking it and trying to remove or change it. The policy exists in the jurisdictions of all of the state’s utilities except LADWP, which has a feed- in tariff program in place and its own net metering policy. Under the state net metering policy, excess electricity a consumer generates with her/his solar power system (or other renewable energy system) is treated as follows:
Credited to customer’s next bill at retail rate. After 12-month cycle, customer may opt to roll over credit indefinitely or to receive payment for credit at a rate equal to the 12-month average spot market price for the hours of 7 am to 5 pm for the year in which the surplus power was generated. (If customer makes no affirmative decision, credit is granted to utility with no compensation for customer.)
While consumers using net metering were exempted from connection charges for years, the rules recently changed, and will coming into effect in July 2017 at the latest. Here are more details from DSIRE:
In January 2016, the California Public Utilities Commission issued a decision on its net metering successor tariff. Customers on the new net metering successor tariff will have to pay an interconnection fee, estimated at $75-$150; pay all non-bypassable charges for all electricity consumed from the grid (~$0.02-0.03/kWh); and go on a time-of-use rate. The net metering successor tariff will take effect for California’s three large investor-owned utilities (IOU) on July 1, 2017, or when 5% of the sum of non-coincident customer peak demand is reached for the IOU, which translates to an installed net-metered capacity of 2,409 MW for Pacific Gas and Electric, 2,240 MW for Southern California Edison, and 617 MW for San Diego Gas and Electric.
Click here to read more about the CPUC’s efforts to create a customer-generator successor tariff or contract.
Virtual net metering is also allowed for multi-family buildings, and an April 2016 CPUC decision added rules for solar-connected storage systems up to 10 kW. Here are some more details on the virtual net metering rules:
AB 2466 of 2008 allows a local government, if certain conditions are met, to distribute bill credits from a renewable energy system across more than one meter. To be eligible for this billing arrangement all electrical accounts involved must receive electricity under a time-of-use tariff, and all accounts must be owned by the same entity.
California also allows virtual net metering for certain utility customers. Originally authorized just for customers participating in the Multifamily Affordable Solar Housing (MASH) program, the CPUC voted in July 2011 in favor of a proposed decision which extends virtual net metering to all multi-tenant properties and to all distributed generation technologies. Virtual net metering allows the bill credits associated with the electricity produced by the system to be distributed across all the tenants’ electricity bills.

Regarding solar + storage, here are the rules:
Energy Storage (IOUs Only)
California allows renewable energy systems coupled with energy storage to qualify for net metering. A chief concern when introducing storage to net metering is the risk that a customer would store grid electricity during times when electricity costs are low and export that same grid electricity during times when electricity costs are high. The CPUC developed rules to address this and other concerns. The CPUC developed different rules for PV systems paired with storage devices 10 kW or less, and PV systems paired with storage devices larger than 10 kW or other forms of renewable energy paired with storage of any size.
PV systems paired with storage devices larger than 10 kW and non-PV renewable energy technologies paired with storage of any size:
The CPUC issued a decision in May 2014 establishing rules for net metering systems paired with storage devices larger than 10 kW. In addition to other requirements, these systems must : 1) install a non-export relay on the storage device(s); 2) install an interval meter for the NEM-eligible generation, meter the load, and meter total energy flows at the point of common coupling; or 3) install an interval meter directly to the NEM-eligible generator(s). While these rules originally applied only to systems paired with storage larger than 10 kW, a subsequent CPUC decision extended these requirements to all non-PV technologies paired with storage of any size.
PV systems paired with storage devices 10 kW or less:
The CPUC issued a decision in April 2016 establishing rules for net metering PV systems paired with storage 10 kW or less. Rather than installing the extra equipment required for storage devices greater than 10 kW, the rules for PV systems paired with smaller storage protects against rate arbitrage by relying on system output estimations. Specifically, utilities are required to establish monthly maximum allowable output limits for net metering facilities using CPUC-approved tools. Any export by the customer’s system which exceeds the monthly limit would not be eligible for net metering credits.
The other big solar incentive in California for years was the California Solar Initiative’s cashback grant for installing solar. However, that program is now closed across the state for residential consumers. It is still open for commercial consumers in the San Diego Gas & Electric district.
That said, there are still numerous other solar incentives available in The Golden State. DSIRE collates the most comprehensive index of solar incentives in the country (or the world) as far as I’m aware. It shows 208 solar incentive programs in California. Of course, most are for specific cities, counties, utility jurisdictions, or special districts. I could quickly paste them all in here, but DSIRE continuously updates the incentives as they change, so I think it’s best to just direct you there to find the incentives that could benefit you.
Solar Installers
First of all, before looking into installers in your area, be sure you are prepared to evaluate installers and solar financing options. You don’t want to go to a solar installer with no background knowledge and info about what you are looking for, just as you don’t want to go to a car dealership in the same way.
Naturally, being the largest solar market in the US (by far), all of the big players in the home solar installation industry operate in California. Here’s the top 10 list (nationally):
- SolarCity
- Vivint Solar
- Sunnova
- RGS Energy (Real Goods Solar)
- Solar Universe
- Bland Solar & Air
- Amergy Solar
- Smart Energy Solar
- KDH Solar
- Direct Solar Energy
It’s not clear if KDH Solar & Direct Solar Energy operate in California, but solar installers #1–8 do.
As hinted above, though, not all installers are equal. Last year, SolarCity’s MyPower prices were found to be 34% higher than the California average. (Note: SolarCity later ended its MyPower program and just launched another home solar loan program.) Keys to evaluate are the types of financing options installers offer (and try to push on you): internally provided solar loans vs solar leases/PPAs vs solar loans from other companies. Then you have to evaluate how those options compare to other financing options you could use, weighing upfront costs, interest rates, timeframes (a 30-year loan is sure to cost you a lot more than a 20-year loan), and what’s included.
Aside from contacting individual installers, you can get quotes from a variety of installers via Cost of Solar, Pick My Solar, EnergySage, Google’s Project Sunroof, and probably other such services.
You can also check reviews on Yelp, but I hear that reviews are commonly planted on the site, so I don’t know how reliable they are.
A comprehensive database of solar installers/contractors was created and is maintained by the California Energy Commission, and you can search for one in your area via this tool.
Solar Costs
According to the Q4 2015 US Solar Market Insight report, average solar PV system pricing breaks out as follows:
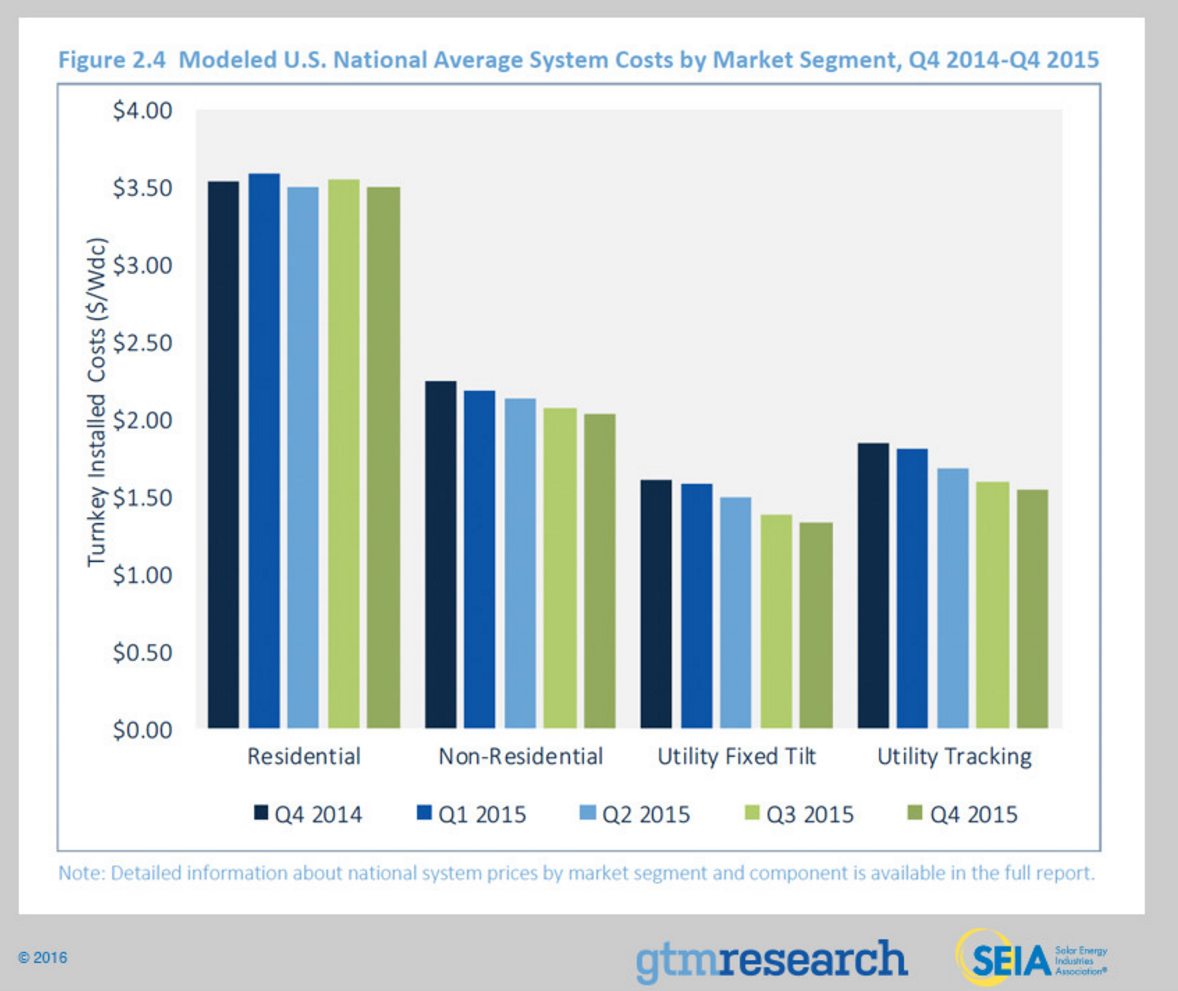
SEIA notes, “Overall system pricing fell by up to 17% over the course of 2015, depending on the market segment, with the largest declines in the utility fixed-tilt sector. On a quarterly basis, pricing continues to trend downward with some levelling-off in the residential sector in particular due to strong investment in customer acquisition and the stubbornness of other soft costs. In the non- residential and utility sectors, there were annual declines of 10% and 17%, respectively. This reflects continued aggressive cost reductions, both in hardware and soft costs, in national system pricing on an aggregate basis. Moreover, as installers and EPCs expand to regions with lower labor and regulatory compliance costs, these regions will have a larger impact on aggregate pricing. Due to advantages from scale, variations in utility system costs are much smaller than variations in residential and non-residential solar costs.”
Here are some more details on solar PV system pricing:

Average pricing for residential rooftop systems landed at $3.50/Wdc in Q4 2015, with nearly 65% of costs coming from on-site labor, engineering, permitting and other soft costs.
While residential hardware costs have fallen by over 16% in the past year, soft costs have actually risen on an industry average basis by 7%, primarily due to rising customer acquisition costs among national and local players alike.
In the non-residential market soft costs remain a challenge as well. Hardware costs fell 15% year- over-year while soft costs saw a modest decrease of 6%. In Q4 2015 soft costs accounted for approximately 50% of total system pricing. Soft costs can be even higher for projects in areas with strict labor requirements and particularly in tough permitting and interconnection jurisdictions. In order to continue reducing costs, developers and EPCs are looking to squeeze additional power density for commercial sites and amortize fixed costs over more power output – and therefore reduce dollar-per-watt and dollar-per-kWh.
California represents nearly 50% of the US solar market. While it’s not clear what the precise averages for solar costs are in California, the state can’t be too far off the average, on average. 😀
Based on the Pick My Solar research noted above regarding SolarCity, the average price of a SolarCity system is $5.10 per watt, while the company found the average price in the state to be $3.60 per watt. That matches up closely with GTM Research & SEIA’s Q4 average of $3.50 per watt. So, I think it’s safe to say that the California average is somewhere between $3.40 per watt and $3.70 per watt (but remember that soft costs have been coming down, and if the trend has continued in 2016, the overall average could be dropping).
If you have more information on solar costs in California, let us know!
Leave a Reply
Solar Savings Calculator
Solar Savings Calculator
Get the facts. Find out exactly how much solar will save you, including which Tax and Financial programs you qualify for!


Leave a Reply