


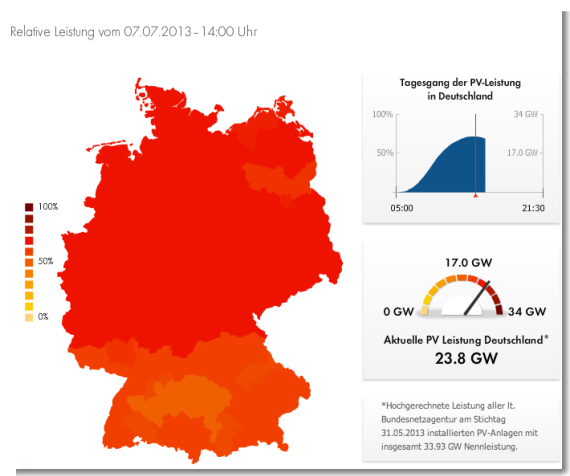
On Sunday, Germany set a new world solar record for electricity produced from solar PV systems at one point in time. It was breaking its own record in the process, as it has done several times. The country’s 1.3 million or so solar PV systems put out 23.9 GW of power. Here’s a screenshot of a live German solar power tool from moments before that happened:
Screenshot of SMA Solar Technology live solar power output webpage.

At the time of the record, solar power was contributing over 50% of Germany’s electricity needs. For Sunday as a whole, it contributed over 20% of the country’s electricity needs.
Unfortunately, there was a bit on Fox & Friends a few months ago that claimed Germany’s solar power leadership (compared to the US) was due to its better solar resources. Unfortunately, that’s as far from the truth as you can get. As you can see in the solar resources map below, Germany’s solar resources are comparable to Alaska’s (actually, even worse):
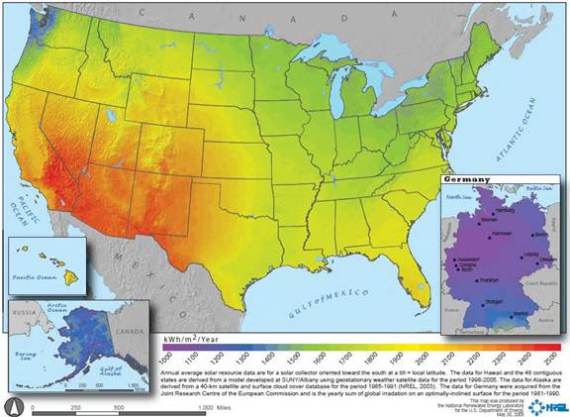
Source: NREL
The key reason Germany is the world’s solar power leader is because it stimulated residential solar installations using a very simple and clear policy tool (solar power feed-in tariffs) that was actually first used by US President Jimmy Carter. This got residents to install solar power before it made financial sense for them to do so (even though it already made financial sense for society as a whole), which has led to major cost reductions in solar PV (just as planned). That has driven down the cost of solar in Germany as well as around the world.
Germany Solar Power Capacity Crushes US Capacity
So, how much of a solar power leader is Germany? Well, if we want to be nice to the US, at the end of 2012, Germany had over 4 times more solar power capacity than the US (32,411 MW versus 7,777 MW).
However, if we recognize that Germany is a smaller country than the US and we look at solar power per capita or per GDP, Germany crushes the US. It has about 399 MW of solar power per million people, compared to about 25 MW per million people in the US (about 16 times more), and it has about 9.5 MW of solar power per $1 billion of GDP, compared to about 0.5 MW per $1 billion of GDP in the US (about 19 times more).
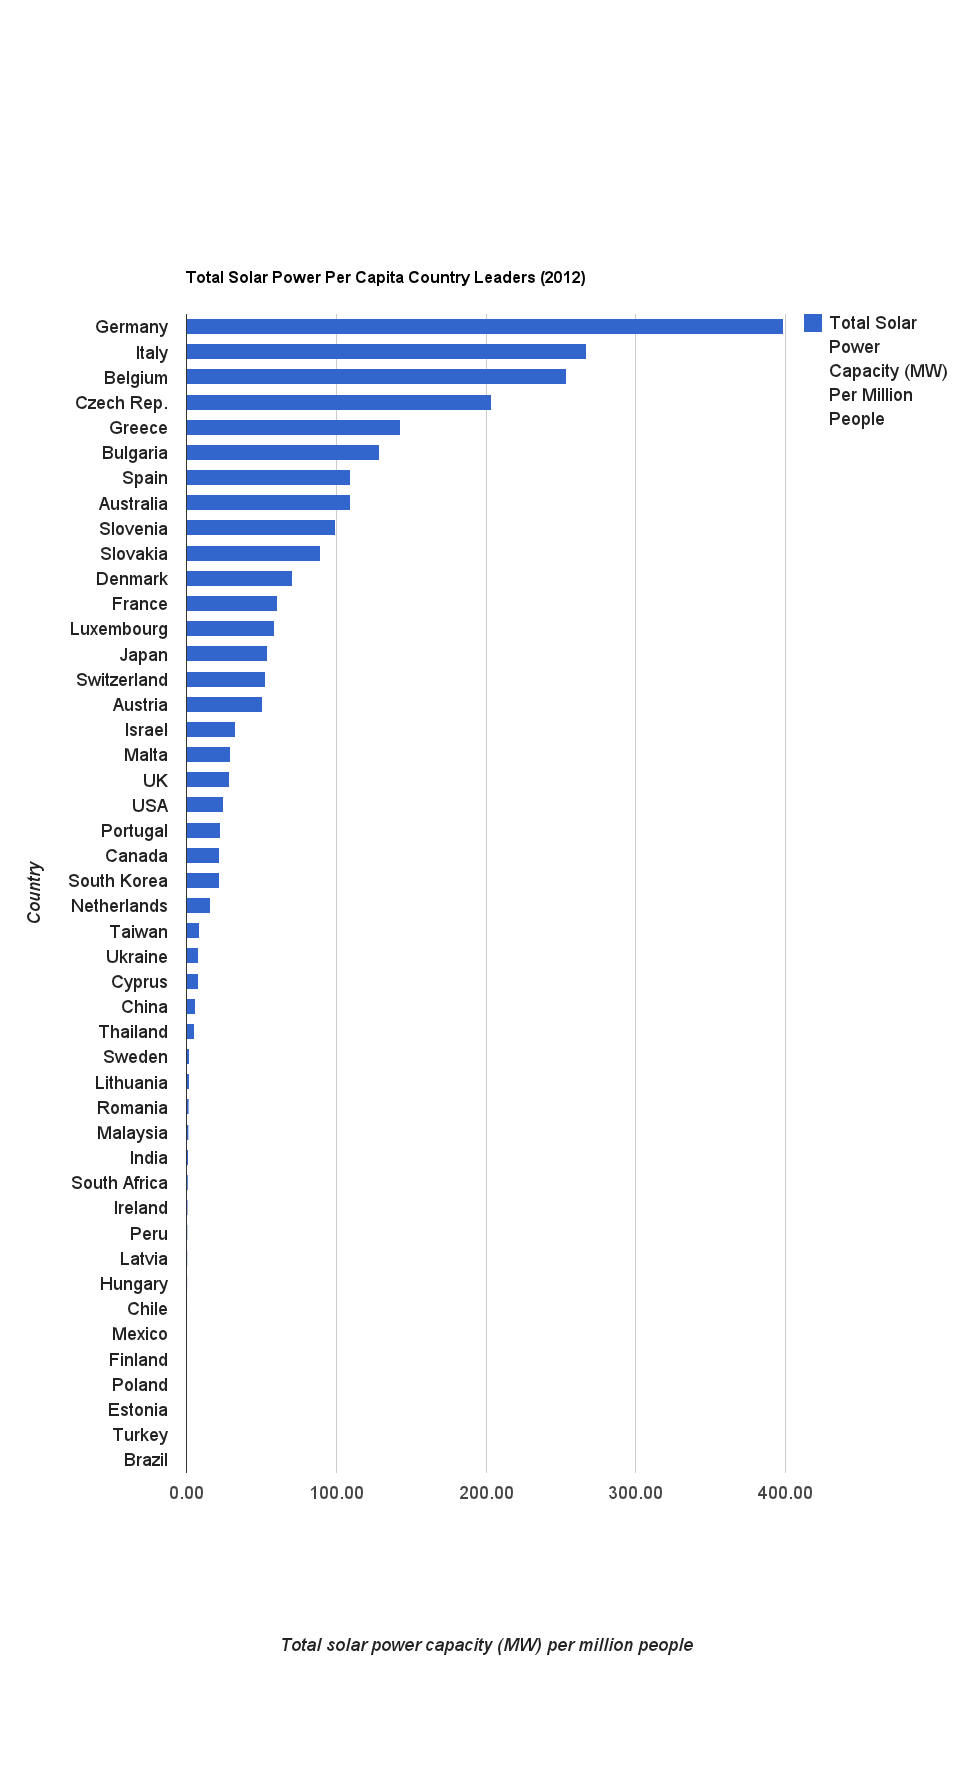
Credit: Zachary Shahan / CleanTechnica
What’s the point of all this? The point is that the US is getting its butt kicked by Germany in the realm of solar power… likely to be one of the biggest (if not the biggest) industry of the economy in the coming century. We need to catch up!!
The good news: remember that solar resources map above? (If not, have another look at it.) The US has excellent solar resources. With the cost of solar panels coming down so much as well as the current availability of residential solar power incentives, solar panels cost less than grid electricity in a large number of places in the US. We can catch up! We just need to get the word out there, bring some fighting spirit to one of the most important things in our life — our electricity supply — and go solar!
Leave a Reply
2 responses to “Germany’s Solar Power Systems Set New Solar Record (Germany Crushing US in Solar Power)”
Leave a Reply
Solar Savings Calculator
Solar Savings Calculator
Get the facts. Find out exactly how much solar will save you, including which Tax and Financial programs you qualify for!


Germany’s Solar Power Systems Set New Solar Record (Germany Crushing US in Solar Power) https://t.co/BH4aK4p0SZ
RT @CostofSolar: Germany’s Solar Power Systems Set New Solar Record (Germany Crushing US in Solar Power) https://t.co/BH4aK4p0SZ