


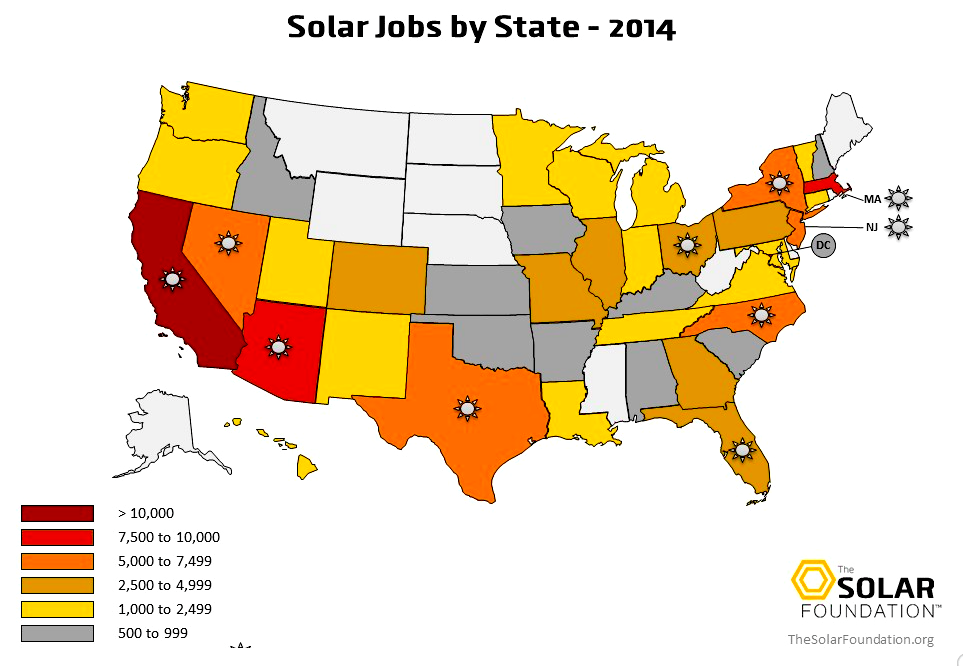
As we mentioned in an earlier article, in 2014 solar jobs grew 20 times faster than US job growth overall (21.8% solar job growth vs. 1.1%). Here’s some further information, state by state. The Solar Foundation, an independent nonprofit based in Washington, DC, just published these amazing numbers in its annual National Solar Jobs Census map.
“From coast to coast, solar is having a huge impact on both our economy and environment. Today, the solar industry employs nearly 175,000 Americans and pumps more than $15 billion a year into the US economy—and we’re just scratching the surface of our enormous potential,” says Rhone Resch, president and CEO of the Solar Energy Industries Association.

The good news also includes the fact that almost half of the states in the US have doubled their solar workforces since 2012. In addition, 28 states (including DC) saw positive growth over last year. Is your state one of them? And are you on board?
Andrea Luecke, President and Executive Director of the foundation, adds that “solar jobs growth is coming from new and exciting places. California is still the undisputed leader, but states like Minnesota, Illinois, and North Carolina are growing aggressively.” California has just set a record by creating over 50,000 solar jobs.
The Silver State, Nevada, has seen 146% solar jobs growth in 2014. It’s also number one for solar jobs per capita. Says Nevada Governor Brian Sandoval: “I am proud that Nevada leads the nation in solar jobs and opportunities. Nevada is emerging as a leader in new technology and innovation and this announcement demonstrates the possibilities within our state if we continue to recruit the growing industries of the 21st century.”
Massachusetts Governor Charlie Baker of Massachusetts, which just passed Arizona as the runner-up, is proud of the Commonwealth’s leadership role in transforming the energy future of the US. “The clean energy economy in Massachusetts is thriving, spurred by the Commonwealth’s innovative spirit, a diverse clean technology industry, strong public-private partnerships, and world class academic institutions,” he said.
The foundation gives specific solar jobs numbers for all 50 states, as well as an assessment and ranking of industry indicators, on a State Solar Jobs Map. Its written study more closely examines the solar markets of Arizona, California, Georgia, Maryland, New York, and Texas, including statistically significant district-level jobs.
All told, installed solar capacity in the US at the end of 2014 could effectively power nearly 4 million homes, or every single home in a state the size of Massachusetts or New Jersey. Analysts expect that number to double by 2016, equivalent to 6.7% of power use by US housing.
Leave a Reply
Solar Savings Calculator
Solar Savings Calculator
Get the facts. Find out exactly how much solar will save you, including which Tax and Financial programs you qualify for!

